This hospitality project is one of the resume project challenges run by Codebasics on a monthly basis.
The Challenge
The challenge is about the imaginary company called AtliQ Grands which owns multiple Five-Star hotels across India. AtilQ Grands is losing business to competitors due to their management’s ineffective decision-making.
Now AtliQ Grands is losing its market share and revenue in the luxury/business hotels category. The revenue management team has decided to use Business and Data intelligence to identify the gaps and make decisions accordingly.
They are looking for a Data Analyst who can provide them with the relevant insights to help them solve this problem.
Tasks
- Create the metrics according to the metric list.
- Create a dashboard according to the mock-up provided by stakeholders.
- Create relevant insights not provided in the metric list/mock-up dashboard.
AtliQ Grands
Some good-to-know stats before starting the visualisation.
- AtliQ Grands a five stars hotel chain is operating in 4 cities.
- It has 7 properties with branches in all these 4 cities.
- The rooms in these properties are categorized into 4 categories: Elite, Premium, Presidential, & Standard.
- There are 6 main platforms to book the rooms and some other platforms that are not as effective as others.
Dataset Provided By Codebasics
dim_date – This table contains dates, week numbers, and day type (weekend and weekday)
dim_hotels – This table contains data like property id, property name, category, and cities
dim_rooms – This table includes room_id and room class
fact_aggregated_bookings – This is a fact tale that contains property id, check-in date, room category, successful bookings, and capacity
metrics list – this data set contains a list of key measures that I will share later along with the DAX formulas used to build these metrics.
fact_bookings – This is another fact table that contains extra data like financials. The data are booking id, property id, booking date, check-out date, check-in date, number of guests, room category, booking platform, ratings, booking status, revenue generated, and revenue realized
There is a list of visual metrics provided by the stakeholders to look into.
- Trends By Weeks –
Revenue
Occupancy %
Avg Rating - Split By City –
Revenue
Occupancy %
Avg Rating - Occupancy By Day Type
- Booking% by Platform
- Filters –
Properties
City
Status
Platform
Month
Week - Table –
Hotels property id
City
Revenue
Occupancy %
Avg rating %
Cancellation rate % - % change vs the previous month
Mockup Dashboard
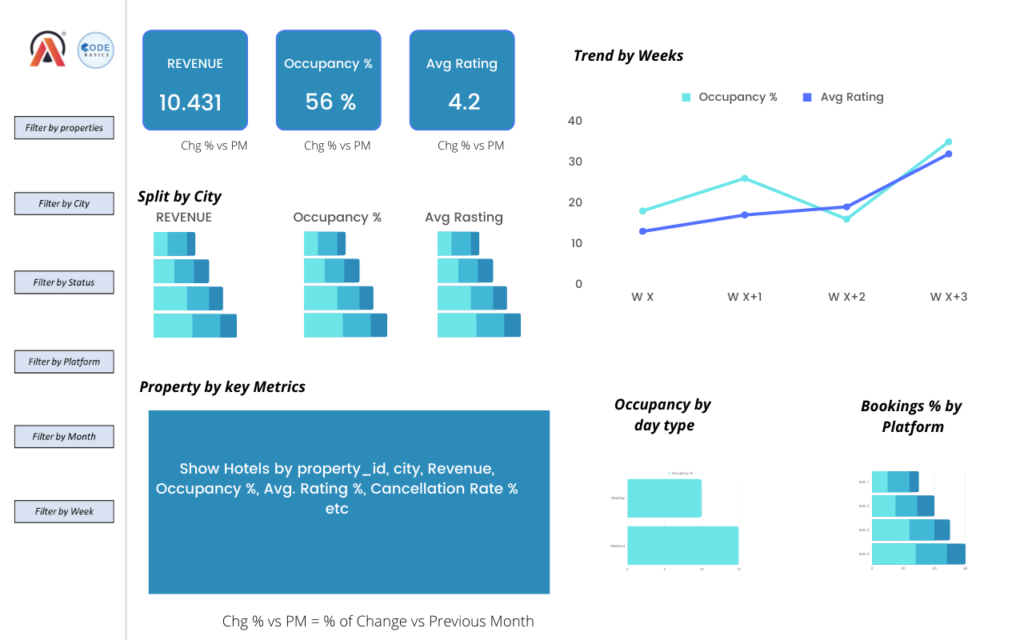
Dashboard Created
Using all the information and data provided by the stakeholders, I analyzed and created this report. This report shows metrics that will help solve the problems faced by AtliQ Grands’s management in generating good revenue.
Data Model Created
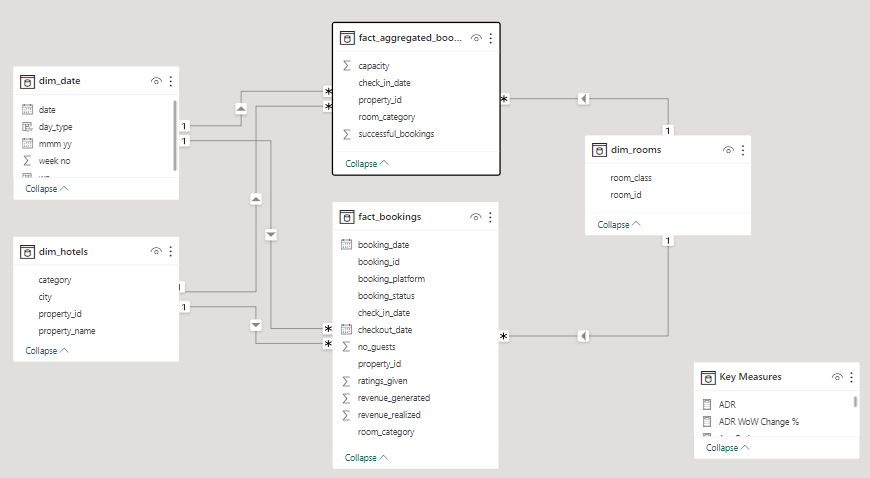
It is a star schema where the fact table/tables are in the centre and they are surrounded by dimension tables.
Data Cleaned
Created calculated columns in dim_date table
- Derived week number from date column using DAX formula =
wn = WEEKNUM(dim_date[date]) - Derived day type from date column using DAX formula =
day_type =
var wkd = WEEKDAY(dim_date[date],1)
return
IF(
wkd>5,”Weekend”,”Weekday”)
Also, the revenue was not directly provided and it was required to be calculated in the dim_bookings from the column revenue_realized.
The revenue columns provided in the data set are:
revenue_generated is the column that contains the amount of money generated by hotels from a customer. (Like cancellation money, no show etc)
revenue_realized: This column represents the final amount of money that goes to the hotel based on booking status. If the booking status is cancelled, then 40% of the revenue generated is deducted and the remaining is refunded to the customer. If the booking status is Checked Out/No Show, then the full revenue generated will go to hotels.
Key Measure Revenue generated using this DAX formula:
Revenue = SUM(fact_bookings[revenue_realized])
Rest all the data was clean and not many changes were required to do.
Report Pages Created
Report View
It is a consolidated view of financial statistics along with the performance of the hotels.
Financial Stats
The financial stats added in this report are the typical metrics that are used only in the hospitality sector. This includes revenue, cancellations, room-level pricing etc.
Here is a list of these financial metrics used in the hospitality industry.
- Revenue as we know is the most common metric used in every industry.
- RevPAR – Revenue generated per available room.
- ADR – Average Daily Rate is the average daily price per room.
These are the main financial statistics that we need to look at micro to macro level.
Performance
The stats related to performance includes the hotel’s occupancy, cancellation %, room availability etc. All these factors directly contribute to the revenue. And some of these factors are controllable by the management whereas some factors are uncontrollable.
Here is the list of metrics:
- DSRN – Daily Sellable Room Nights is the metric used for available rooms that can be sold. Example: If there are 100 rooms in a hotel and 20 rooms are not available for any XYZ reason, the DSRN here is 80.
- DBRN – Daily Booked Room Nights are the number of nights booked per night.
- DURN – Daily Utilized Room Nights are the nights utilized or used by the customers. This can be the checked-in nights.
- Cancellation % – As the name suggests, it is the percentage of cancelled bookings.
- Avg Rating – Average rating is the average rating given by a customer per booking.
- Day Type – Day is the category of days in a week. Weekday and Weekend. In the hospitality sector, the weekend is Friday and Saturday. Most of the customers checkout on Sunday.
- Booking Platforms – Booking platforms are the modes that are used by customers to book rooms. These include AtliQ’s own booking platform and third-party platforms as well.
- Week Number – Week number is the number of weeks in a year.
- Property Name – Property name is the name of individual hotels.
- Property ID – Property ID is the unique ID given to the properties.
- WoW – Week on Week is the metric to compare the performance change over the week.
Filters Used
- Week Number – To view each week’s performance.
- Month – To measure monthly performance.
- Property – This will give insights into each property that will help in effective decision-making.
- City – This filter helps in knowing the market value of AtilQ
- Room Class – Looking into room class can drill down the problems and challenges faced by hotels. Example: Ratings will help in improving the standards of the room. Availability will help in providing more rooms with the category in high demand.
- Booking Platforms – Choosing booking platforms provides insights to the marketing team to target accordingly. Also, improving AtliQ’s own platforms for generating direct revenue.
Finance View
The finance view includes similar filters to the consolidated report page and excludes the performance metrics. Here all the charts are providing financial performance on micro and macro levels (after applying filters).
This report is for financial analysis of the business.
Key Insights Derived From The Report
Financial Performance
By Hotels
| Performance | Name | Value | |
| Revenue | Highest | AtliQ Exotica | 320M |
| Lowest | AtliQSeasons | 66M | |
| RevPAR | Highest | AtliQ Exotica | 7.8k |
| Lowest | AtliQ Grands | 6.5k | |
| ADR | Highest | AtliQ Seasons | 16.6k |
| Lowest | AtliQ Blu | 11.9k | |
By Room Class
| Performance | Name | Value | |
| Revenue | Highest | Elite | 560M |
| Lowest | Standard | 310M | |
| RevPAR | Highest | Presidential | 13.7k |
| Lowest | Standard | 4.7k | |
| ADR | Highest | Presidential | 23.4k |
| Lowest | Standard | 8.1k | |
By City
| Performance | Name | Value | |
| Revenue | Highest | Mumbai | 668.6M |
| Lowest | Delhi | 294.5M | |
| RevPAR | Highest | Mumbai | 8.9k |
| Lowest | Hyderabad | 5.4k | |
| ADR | Highest | Mumbai | 15.4k |
| Lowest | Hyderabad | 9.3k | |
Abbreviations of Metrics
| Realization | Utilized Room Nights / Booked Room Nights |
| RevPAR | Revenue Per Available Room |
| ADR | Average Daily Rate |
| DBRN | Daily Booked Room Nights |
| DSRN | Daily Sellable Room Nights |
| DURN | Daily Utilized Room Nights |
| Revenue WoW change % | Revenue Week Over Week Change |
Kye Measures Created
| 1 | Revenue | = SUM(fact_bookings[revenue_realized]) |
| 2 | Total Bookings | = COUNT(fact_bookings[booking_id]) |
| 3 | Total Capacity | = SUM(fact_aggregated_bookings[capacity]) |
| 4 | Total Succesful Bookings | Total Succesful Bookings = SUM(fact_aggregated_bookings[successful_bookings]) |
| 5 | Occupancy % | = DIVIDE([Total Succesful Bookings],[Total Capacity],0) |
| 6 | Average Rating | = AVERAGE(fact_bookings[ratings_given]) |
| 7 | No of days | = DATEDIFF(MIN(dim_date[date]),MAX(dim_date[date]),DAY) +1 |
| 8 | Total cancelled bookings | = CALCULATE([Total Bookings],fact_bookings[booking_status]=”Cancelled”) |
| 9 | Cancellation % | = DIVIDE([Total cancelled bookings],[Total Bookings]) |
| 10 | Total Checked Out | = CALCULATE([Total Bookings],fact_bookings[booking_status]=”Checked Out”) |
| 11 | Total no show bookings | = CALCULATE([Total Bookings],fact_bookings[booking_status]=”No Show”) |
| 12 | No Show rate % | = DIVIDE([Total no show bookings],[Total Bookings]) |
| 13 | Booking % by Platform | = DIVIDE([Total Bookings],CALCULATE([Total Bookings], ALL(fact_bookings[booking_platform]) ))*100 |
| 14 | Booking % by Room class | = DIVIDE([Total Bookings], CALCULATE([Total Bookings], ALL(dim_rooms[room_class]) ))*100 |
| 15 | ADR | = DIVIDE( [Revenue], [Total Bookings],0) |
| 16 | Realisation % | = 1- ([Cancellation %]+[No Show rate %]) |
| 17 | RevPAR | = DIVIDE([Revenue],[Total Capacity]) |
| 18 | DBRN | = DIVIDE([Total Bookings], [No of days]) |
| 19 | DSRN | = DIVIDE([Total Capacity], [No of days]) |
| 20 | DURN | = DIVIDE([Total Checked Out],[No of days]) |
| 21 | Revenue WoW change % | = Var selv = IF(HASONEFILTER(dim_date[wn]), SELECTEDVALUE(dim_date[wn]),MAX(dim_date[wn])) var revcw = CALCULATE([Revenue],dim_date[wn]= selv) var revpw = CALCULATE([Revenue],FILTER(ALL(dim_date),dim_date[wn]= selv-1)) return DIVIDE(revcw,revpw,0)-1 |
| 22 | Occupancy WoW change % | = Var selv = IF(HASONEFILTER(dim_date[wn]), SELECTEDVALUE(dim_date[wn]),MAX(dim_date[wn])) var revcw = CALCULATE([Occupancy %],dim_date[wn]= selv) var revpw = CALCULATE([Occupancy %],FILTER(ALL(dim_date),dim_date[wn]= selv-1)) return DIVIDE(revcw,revpw,0)-1 |
| 23 | ADR WoW change % | = Var selv = IF(HASONEFILTER(dim_date[wn]), SELECTEDVALUE(dim_date[wn]),MAX(dim_date[wn])) var revcw = CALCULATE([ADR],dim_date[wn]= selv) var revpw = CALCULATE([ADR],FILTER(ALL(dim_date),dim_date[wn]= selv-1)) return DIVIDE(revcw,revpw,0)-1 |
| 24 | Revpar WoW change % | = Var selv = IF(HASONEFILTER(dim_date[wn]), SELECTEDVALUE(dim_date[wn]),MAX(dim_date[wn])) var revcw = CALCULATE([RevPAR],dim_date[wn]= selv) var revpw = CALCULATE([RevPAR],FILTER(ALL(dim_date),dim_date[wn]= selv-1)) return DIVIDE(revcw,revpw,0)-1 |
| 25 | Realisation WoW change % | = Var selv = IF(HASONEFILTER(dim_date[wn]), SELECTEDVALUE(dim_date[wn]),MAX(dim_date[wn])) var revcw = CALCULATE([Realisation %],dim_date[wn]= selv) var revpw = CALCULATE([Realisation %],FILTER(ALL(dim_date),dim_date[wn]= selv-1)) return DIVIDE(revcw,revpw,0)-1 |
| 26 | DSRN WoW change % | = Var selv = IF(HASONEFILTER(dim_date[wn]), SELECTEDVALUE(dim_date[wn]),MAX(dim_date[wn])) var revcw = CALCULATE([DSRN],dim_date[wn]= selv) var revpw = CALCULATE([DSRN],FILTER(ALL(dim_date),dim_date[wn]= selv-1)) return DIVIDE(revcw,revpw,0)-1 |


Amazing dashboard and the way you have given overall information is fantastic. It will also be helpful for aspiring data analyst.
Thank You, Sudha! 🙂