About Challenge
Challenge: Analyse Growth and Present Insights to the Telangana
The challenge is about analysing the Telangana State’s growth in various sectors and presenting insights to the stakeholders.
Stakeholders:
Kalvakuntla Taraka Rama Rao
Minister for IT, Industries and Municipal Administration

Jayesh Ranjan
Secretary, Information Technology (IT); Government of Telangana
Dileep Konatham
Director at Government of Telangana

Venu Panjarla
Open Data Telangana
About Project
We are provided with 2 dimension tables and 3 fact tables.
All the data used in the project is real data available on the Government of Telangana’s Open Data portal.
https://data.telangana.gov.in/
Dimension tables:
- dim_date – This table contains the dates at the monthly level. Please be aware that the fiscal year of Telangana spans from April to March.
- dim_districts – The table contains information about districts.
Fact Tables:
- fact_stamps – The table provides data on the revenue generated from document registrations and E-stamp challan payments aggregated at the district and monthly level.
- fact_transport – The table provides information about the individual vehicle sales data from the RTA(Regional Transport Authority) of the state of Telangana categorized by fuel type, vehicle class, seating capacity, and other general categories aggregated at the district and monthly level.
- fact_TS_ipass – The TS-iPASS dataset in Telangana comprises data concerning units or businesses established within the state under the “Industrial Project Approval and Self-Certification System” (iPASS). This government initiative aims to foster industrial growth and investment by streamlining project approvals and enabling self-certification for businesses.
More details about the challenge are here:
Codebasics Resume Project Challenge
Objective:
- Explore Stamp Registration, Transportation and Ts-Ipass Datasets. Understand their attributes, categories and time periods.
- Analyze trends and patterns within each department.
- Identify growth opportunities and areas needing attention.
- Find correlations among these departments and report the overall growth of the state through insights and relevant visuals such as shape maps.
Telangana
Telangana is one of the fastest-growing states in India
Telangana’s growth from 2017 – 2022
- 128.3% (5th highest in India)
- Telangana
- Total 63 SEZ (Special Economic Zones)
- $21Bn investment attracted since 2014
- 1.5 Lakh Acres Land
- 3621 MW Solar Capacity
Resource: https://invest.telangana.gov.in/
Live Dashboard
Note: As this is a government project, I chose calm colours and tried to match the Telangana open data website theme.
Project
Problem Statements & Solutions
Stamp Registration
1. How does the revenue generated from document registration vary across districts in Telangana? List down the top 5 districts that showed the highest document registration revenue growth between FY 2019 and 2022.
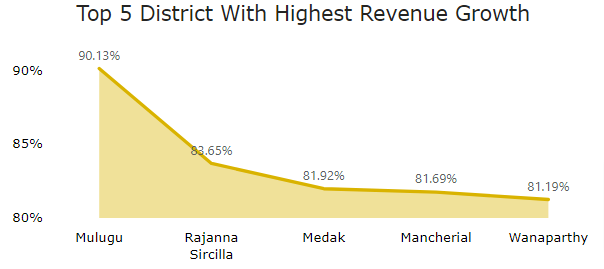
Top 5 districts with the highest document registration revenue growth between FY 2019 and 2022
- Mulugu – 90.13%
- Rajanna Sircilla – 83.65%
- Medak – 81.92%
- Mancherial – 81.69%
- Wanaparthy – 81.19
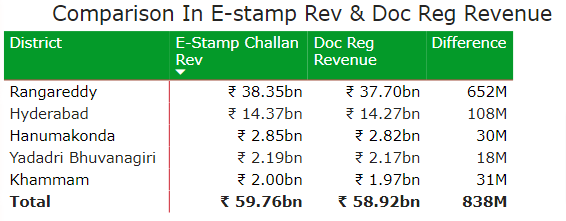
2. How does the revenue generated from document registration compare to the revenue generated from e-stamp challans across districts? List down the top 5 districts where e-stamps revenue contributes significantly more to the revenue than the documents in FY 2022.
The top 5 districts where e-stamp revenue contributes significantly more to the revenue than the revenue generated by document registration in FY 2022.
- Rangareddy
- Hyderabad
- Hanumakonda
- Yadadri Bhuvanagiri
- Khammam
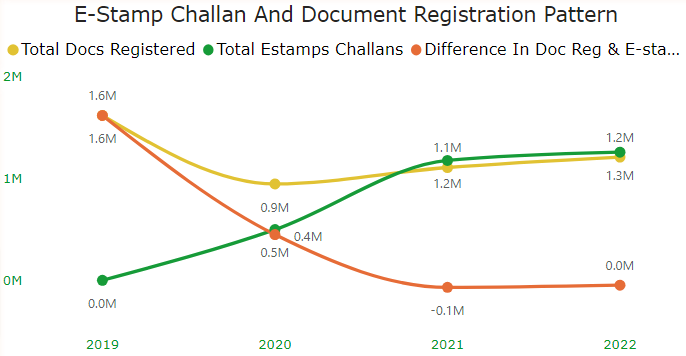
3. Is there any alteration of the e-Stamp challan count and document registration count pattern since the implementation of the e-Stamp challan? If so, what suggestions would you propose to the government?
E-Stamp challan is widely accepted and in a short span of time, the count of stamp registrations doubled.
My recommendation to the government is to encourage more and more people to use online services which makes it easy to track progress.
Promoting online processes will also save money and resources for the government.
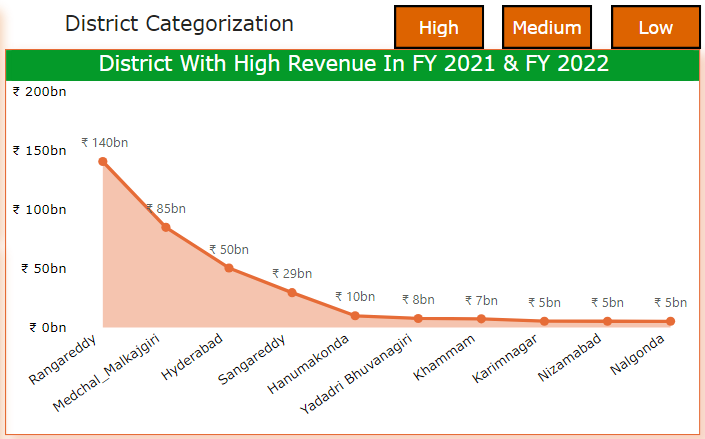
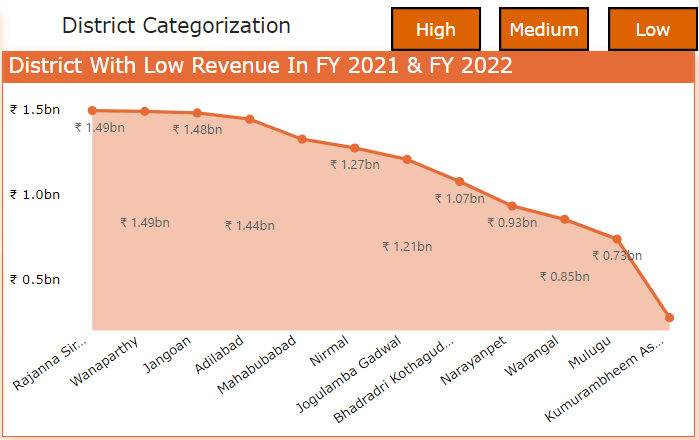
4. Categorize districts into three segments based on their stamp registration revenue generation during the fiscal year 2021 to 2022.
I divided the districts into 3 categories. (From FY 2021 To FY 2022)
- High – Top 10 districts with high revenue.
- Medium – 10 District with average revenue.
- Low – The rest of the districts with low Revenue.
Top 10 districts in the High revenue category.
- Rangareddy
- Medchal Malkajgiri
- Hyderabad
- Sangareddy
- Hanumakonda
- Yadadri Bhuvanagiri
- Khammam
- Karimnagar
- Nizamabad
- Nalgonda
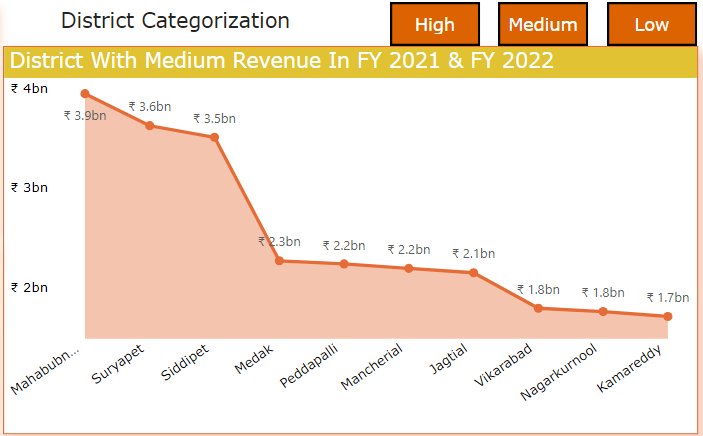
Districts in Medium category.
- Mahabubnagar
- Suryapet
- Siddipet
- Medak
- Peddapalli
- Mancherial
- Jagtial
- Vikarabad
- Nagarkurnool
- Kamareddy
Districts in the Low category.
- Rajanna Sircilla
- Wanaparthy
- Jangoan
- Adilabad
- Mahabubabad
- Nirmal
- Jogulamba Gadwal
- Bhadradri Kothagudem
- Narayanpet
- Warangal
- Mulugu
- Kumurambheem Asifabad
Transportation
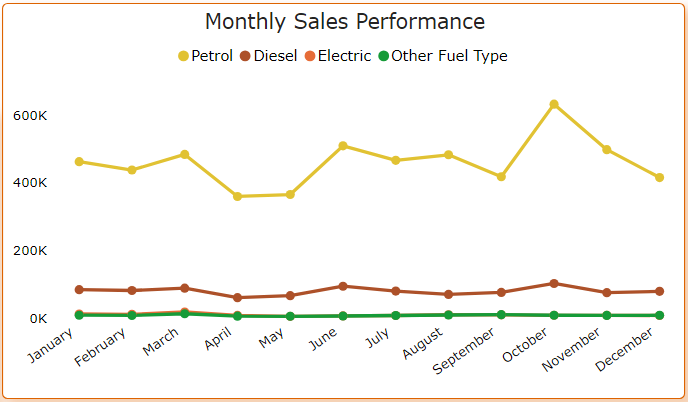
5. Investigate whether there is any correlation between vehicle sales and specific months or seasons in different districts. Are there any months or seasons that consistently show higher or lower sales rate, and if yes, what could be the driving factors? (Consider Fuel-Type category only)
In October month of every year the vehicle sales increase and it drops in November and December.
October is the month of festivals. Diwali is the biggest festival in India when consumers shop from gold to cars or even properties. Companies come up with great discounts and offers that buyers can’t ignore.
In January the vehicles make year changes to a year old and this affects the resell value of the vehicle. So, some buyers avoid buying cars in December.
6. How does the distribution of vehicles vary by vehicle class (MotorCycle, MotorCar, AutoRickshaw, Agriculture) across different districts? Are there any districts with a predominant preference for a specific vehicle class? Consider FY 2022 for analysis.
Districts with a predominant preference for a specific vehicle class in FY 2022. (based on the vehicle class like Motor Cycle, Motor Car, Auto Rickshaw, and Agriculture)
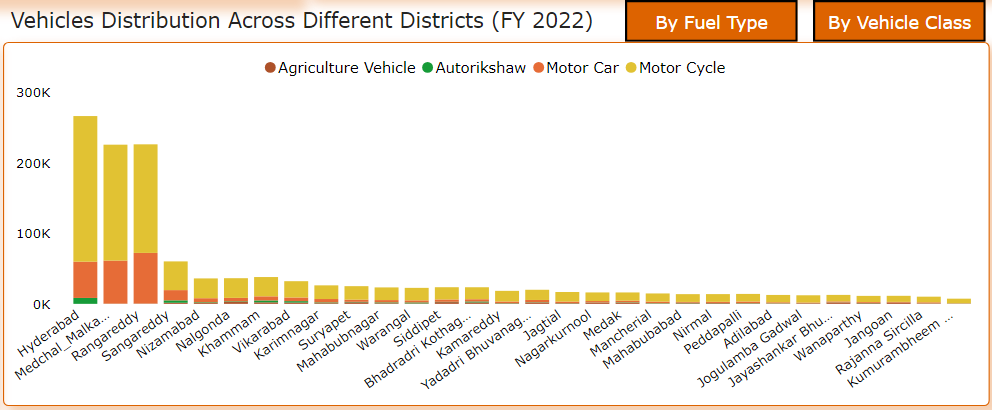
Hyderabad For Motorcycles.
Rangareddy For Motor Car.
Hyderabad For Autorikshaw.
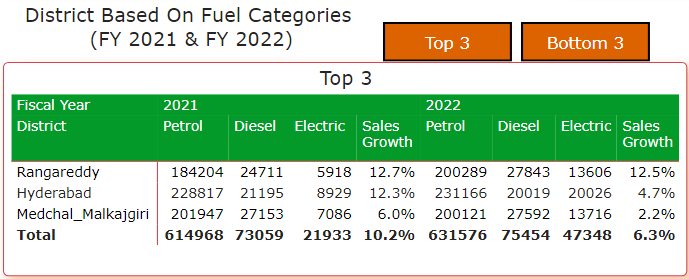
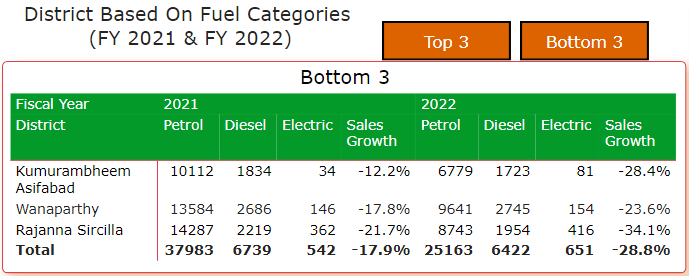
7. List down the top 3 and bottom 3 districts that have shown the highest and lowest vehicle sales growth during FY 2022 compared to FY 2021. (Consider and compare categories: Petrol, Diesel and Electric)
The top 3 districts that have shown the highest vehicle sales growth during FY 2022 compared to FY 2021. (Categories: Petrol, Diesel and Electric)
- Medchal Malkajgiri
- Hyderabad
- Rangareddy
The bottom 3 districts that have shown the lowest vehicle sales growth during FY 2022 compared to FY 2021. (Categories: Petrol, Diesel and Electric)
- Wanaparthy
- Kumurambheem Asifabad
- Rajanna Sircilla
Ts-Ipass (Telangana State Industrial Project Approval and Self Certification System)
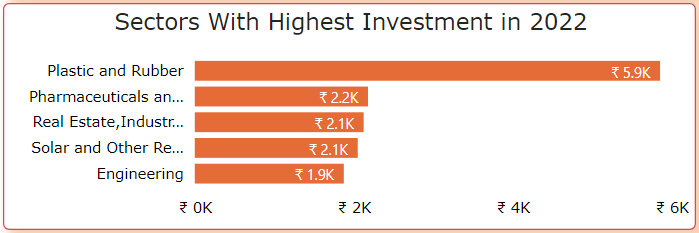
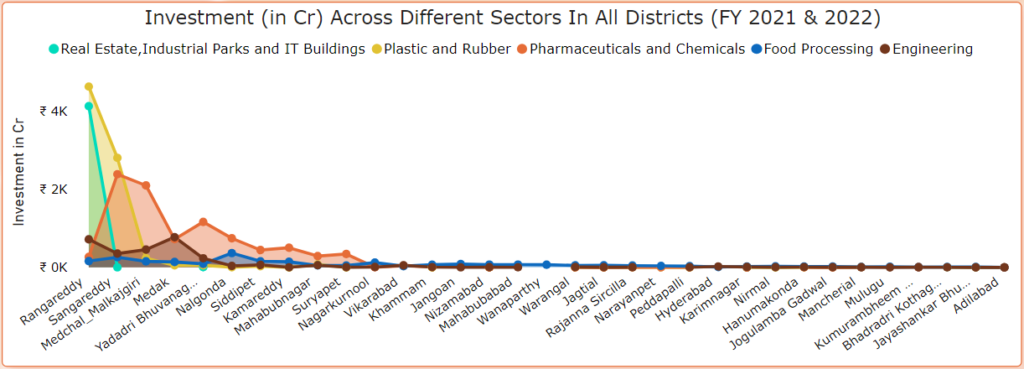
8. List down the top 5 sectors that have witnessed the most significant investments in FY 2022.
Top 5 sectors that have witnessed the most significant investments in FY 2022.
- Plastic & Rubber
- Pharmaceuticals & Chemicals
- Real Estate, Industrial Parks & IT Buildings
- Solar and other Renewable Energy
- Engineering
9. List down the top 3 districts that have attracted the most significant sector investments during FY 2019 to 2022. What factors could have led to the substantial investments in these particular districts?
Top 3 districts that have attracted the most significant sector investments during FY 2019 to 2022.
- Rangareddy
- Sangareddy
- Medchal Malkajgiri
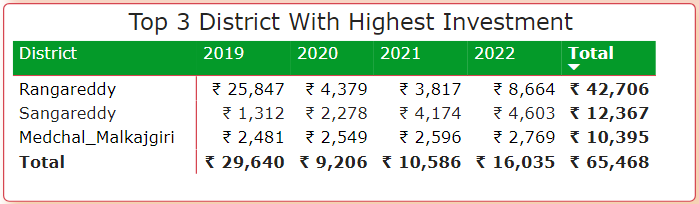
One reason can be the positive news associated with these districts. News like Foxconn is committed to investing more than $300M in one of these districts.
Source: TOI
There are similar positive news associated with districts which attract more investments from different sectors.
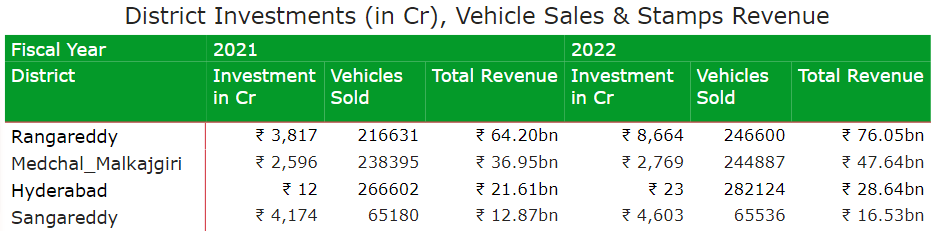
10. Is there any relationship between district investments, vehicle sales and stamps revenue within the same district between FY 2021 and 2022?
- Rangareddy
- Medchal Malkajgiri
- Hyderabad
- Sangareddy
These are all neighbouring districts with significantly high revenue, vehicle sales and revenue as compared to the rest of the districts. These are very well connected with each other and in the middle of them, Hyderabad being the capital is well equipped with all the facilities, infrastructure and transportation services. Hyderabad also has a good population of skilled workers.
11. Are there any particular sectors that have shown substantial investment in multiple districts between FY 2021 and 2022?
Sectors that have shown substantial investment in multiple districts between FY 2021 and 2022.
- Plastic & Rubber
- Pharmaceuticals & Chemicals
12. Can we identify any seasonal patterns or cyclicality in the investment trends for specific sectors? Do certain sectors experience higher investments during particular months?
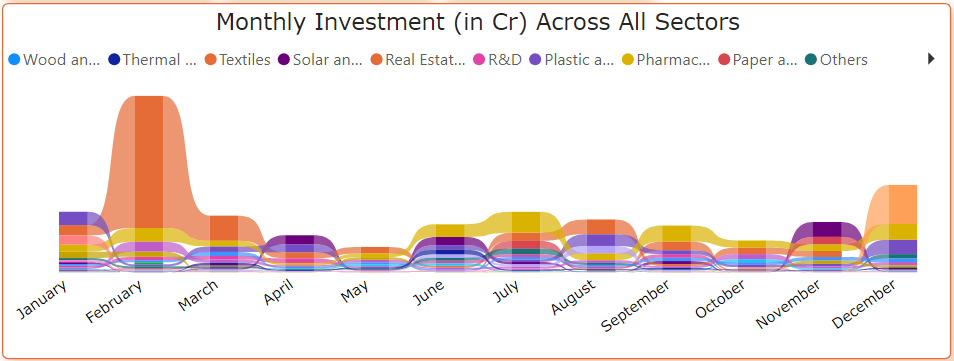
There are certain sectors that experience higher investments during particular months.
February – Real Estate, Industrial Parks & IT Buildings
Reason – Financial year ending in March – The financial year in India ends in March and every year to save taxes, businesses and individuals invest money in multiple assets. Property is one such asset which requires huge investment and hence more tax can be saved.
December – Fertilizers, Organic and inorganic, Pesticides, Insecticides and Other Related
Reason – Farming Season Starts in November – Every year the main farming season starts in November as it is a winter or cold season which is suitable for farming. This brings more business or investment opportunities.
More Insights
1. What are the top 5 districts to buy commercial properties in Telangana? Justify your answer.
Rangareddy, Medchal Malkajgiri & Sangareddy –
It surrounds Hyderabad and is well connected with it. It capitalises on the benefits provided to the capital like good infrastructure and transportation.
Hyderabad –
Hyderabad is a capital and it is always the first priority for new businesses to start from here and capitalize the existing incentive scheme by local Govt.
Warangal –
Warangal is another rapidly growing district. There is also an approved Airport plan for Warangal. This will be a good opportunity to acquire land near the proposed Airport which will later increase the land value.
Source: Warangal Airport
2. What significant policies or initiatives were put into effect to enhance economic growth, investments, and employment in Telangana by the current government? Can we quantify the impact of these policies using available data?
The policies or initiatives that were put into effect to enhance economic growth, investments, and employment in Telangana by the current government are:
- Single Clearance Window – Businesses do not need to wait in most cases can start doing business from day 1.
- The Right to Clearances policy under which Entrepreneurs can know the reason for the delay in their application and penalise the responsible officers for the delay.
- Various incentives like reimbursement of stamp duties, Power Tariff, industrial land acquisition duties, employee training incentives etc.
- Meet Or Greet Policy – The Telangana government is ready to offer opportunities that will either match or supersede any package offered anywhere in the world for industries.
- New Approved Airports – There are 3 new approved airports in the Telangana state and they will improve the transportation for businesses and help in tourism and economy.
List Of Incentives
More Information About Incentives
3. Provide the top 5 Insights & 5 recommendations to the Telangana government for sustained growth in the next 5 years based on your analysis.
Top 5 Insights
- More than 50% of the revenue is generated by 3 districts.
- More than 50% of the investment is done only in 3 districts that too are neighbours to each other.
- Even after COVID-19, the revenue increased by 19.42% and investment also grew by 142.79% which means the government’s policies are good. Currently, diversification is required.
- Out of 7M vehicles sold, EVs are just 103k.
- October month has an average of 700k vehicle sales from 2019 to 2022.
Top 5 Suggestions
- Invest more in Agriculture.
- Focus on solar projects.
- Diversify investments in the rest of the districts.
- Investment in Bhadradri Kothagudem is good but the revenue needs to be improved. This is an important district as this is close to the seaport and helps in improving exports by reducing travel time.
- The government of India is currently focusing on bringing in EV makers and EV parts manufacturers, so this can be the chance to bring the most emerging sector to the state. This will boost employment.
Tools used in building the project:
MS Excel
PowerBI
Canva – For PPT
Thank You!
Please share your valuable feedback with me in the comments.
Nice could you plz help us to make this kind of project and report
Hi Payal,
Sure.
Are you asking about the blog or just the project?