The Business Insights project is a part of the Codebasics Data Analytics Bootcamp.
This is an end-to-end Data Analysis and Power BI project which is based on an imaginary company called AtliQ Hardware.
About AtliQ Hardware
AtliQ Hardware manufactures and sells hardware like PC, Mouse, Printers etc to multiple companies across the world. AtliQ’s customers are companies like Croma, Amazon, Neptune, Staples, Walmart etc.
These customers are of two types – Physical Stores and E-commerce platforms.
Problem Statement
AtliQ Hardware is struggling to do good business in Latin America.
So far all the decisions that AtliQ took have been based on some surveys and intuitions.
The company was doing some analysis using MS Excel files because of limited data. Now that the company has grown and has plenty of data to analyse, the management has decided to hire a Data Analyst. The management wants Data Analysts to utilise this data to make accurate and informed decisions.
Management’s Dashboard Requirements
The management wants to see these reports in the Power BI Dashboard:
Finance View – This will show the profit and loss statements across different products, markets, customers etc.
Sales View – To display the top-performing and bottom-performing customers with different key metrics.
Marketing View – Similar data as of Sales View but product based instead of customers.
Supply Chain – Reliability and accuracy to better understand the supply chain performance.
Executive View – Thi includes the integrated view of key insights for executives.
Dashboard Created (Dynamic Dashboard)
This Power BI project is not just a project but a course created with real-life business scenarios. Like recorded business meetings with stakeholders. Feedback after every design is created and shared with the stakeholders, changing and adding features to the report that saves time and provides all the required key metrics in the consolidated report. etc.
Project Execution
Step – 1
The first step was to load the data into MySQL Database and connect it to the Power BI.
Step 2
Review and deleted the Database relationship created by Power BI by default.
Also, creating the required dimension table in Power Query.
Step – 3
Data validation using some tables in Power BI and matching the values with the data provided.
Step – 4
Data Transformation. For example, creating a Last Sales Month Reference table. So the last sales month reference table will be dynamic and will change after every sale.
Step – 5
Created calculated columns in Power Query like fiscal_year and merged the tables.
Step – 6
Data Modelling – Data modelling is a connection between different tables using a common table between them. In this project, Start Schema is used for Data Modelling where all the dimension tables were connected with Fact tables.
Step – 7
Created calculated columns using more than 40 DAX formulas (Formulas listed at the bottom). After the columns were created, verified them in either MySQL or Excel file.
Step – 8
This was the last step before start creating the design work and building the dashboards. This step was to optimize the report to reduce the report/file size. This is an important step which helps in reducing the file size so that is easy to share and access by users.
Building The Dashboard
I have created 5 different report views in this report which serves the need of various stakeholders. Let’s have a look at each of them.
The first page of the report is a home page with the navigation to all other views and a summary of each page so a user can directly access the report they need to look at.
Finance View
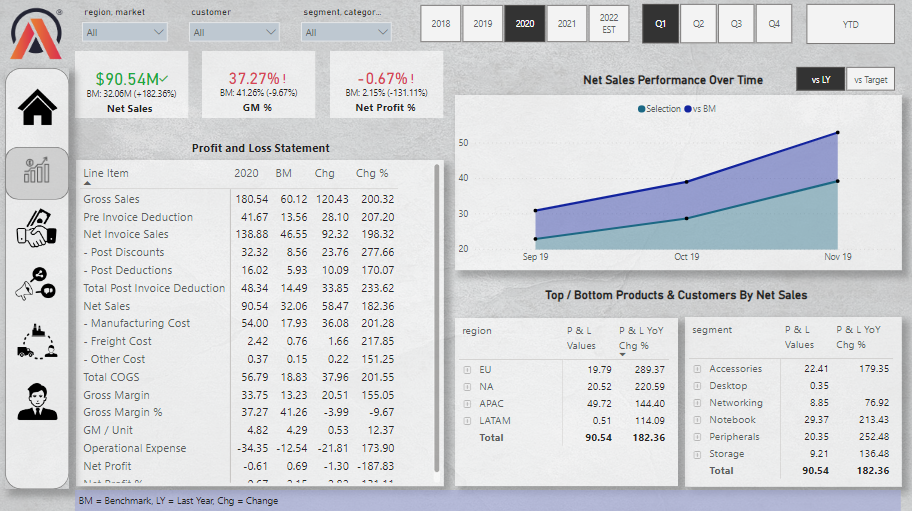
The Finance View shows the P & L statements. The Top Performing and Bottom Performing products and customers. Different product segment performances in different regions. The most important metric here is it shows the Year on Year comparison of P & L in a single view.
There is one button created for this view which displays the Net Sales performance Vs Last Year and Vs Target. This helps in decision-making by comparing past performance with the target to achieve the desired goals.
Sales View
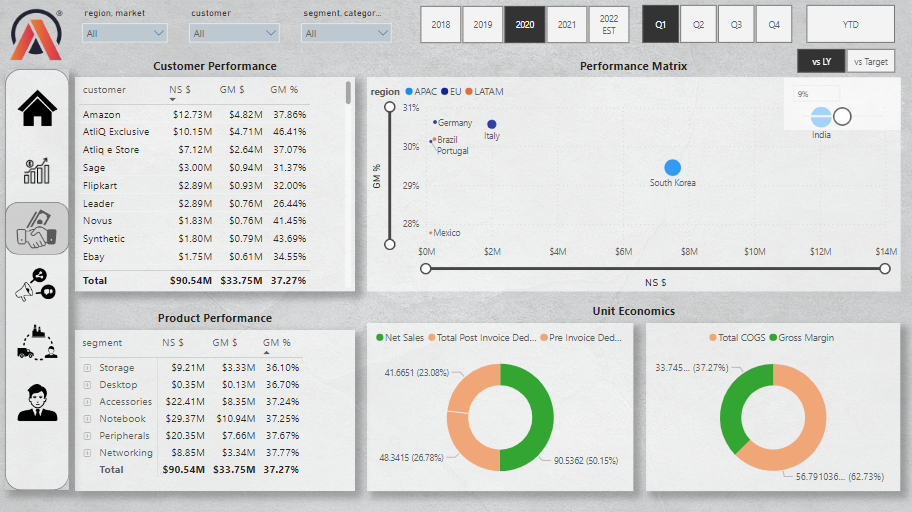
The sales view is for the sales team to drill down the performance of each product and customer in individual regions. Similar to the finance view it does have the same filters to provide in-depth analysis of sales performance.
Marketing View
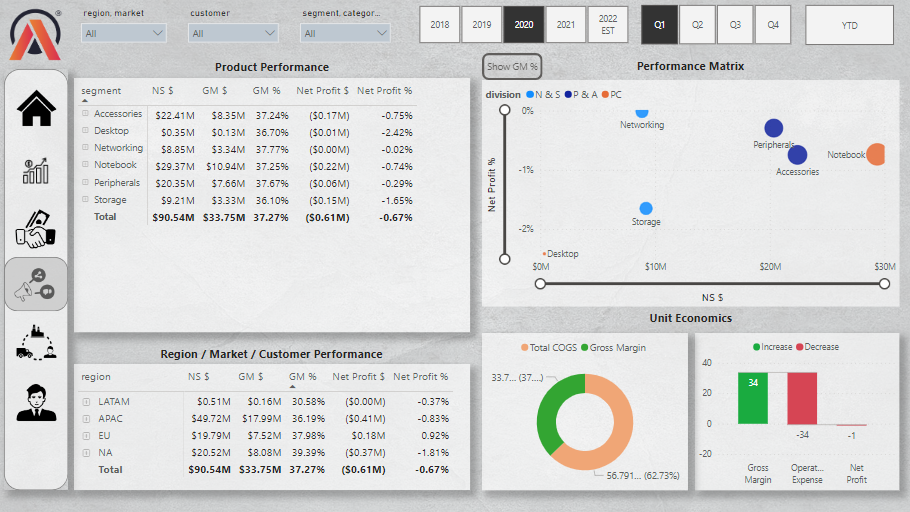
Marketing View contains Gross Margin %, Net Profit %, Operational Expenses and Cost Of Goods Sold which are important financial stats that marketing should be aware of. This helps in deciding the marketing budget for each product in a particular market. Marketing will also be aware of the potential customers and potential market and whether there is a scope for business or not.
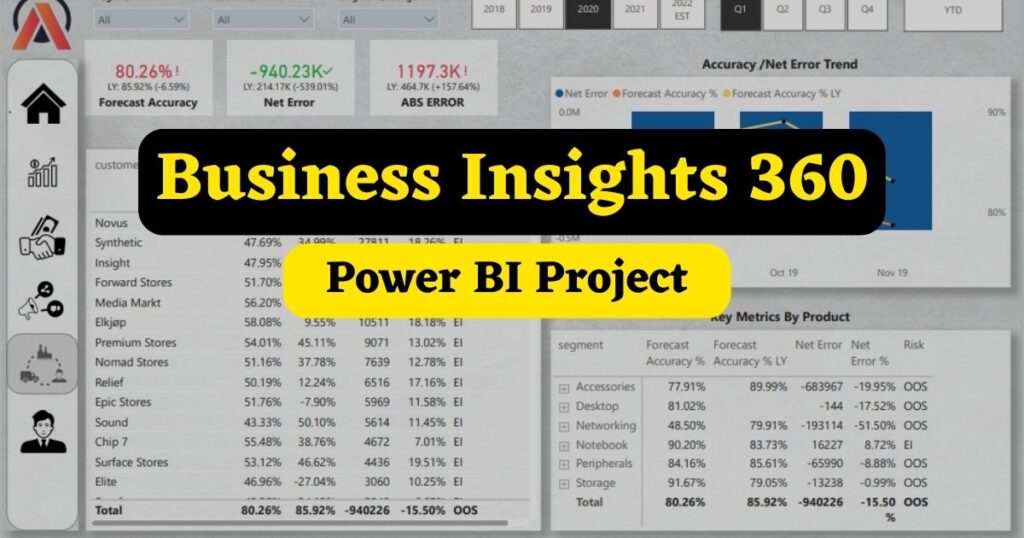
Supply Chain View
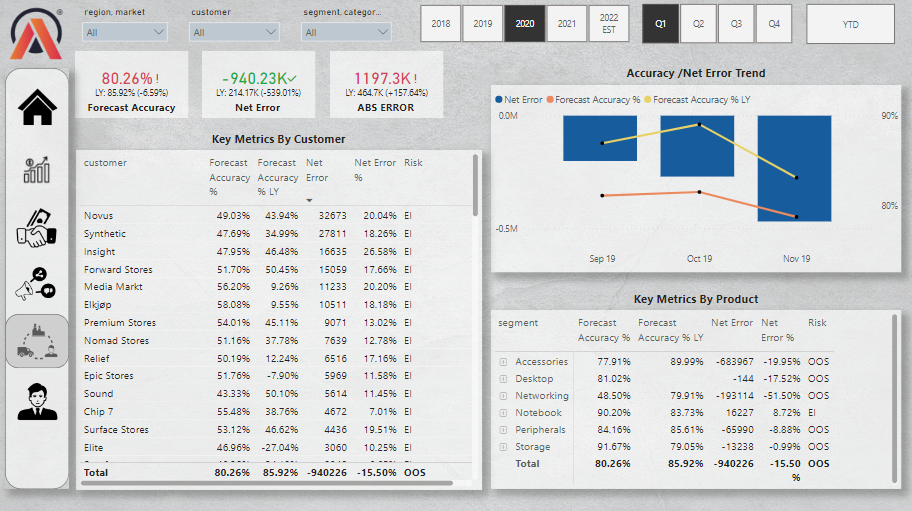
The supply chain is also a very important part of any business which if not planned timely can increase the operating cost. Keeping an inventory involves some cost and similarly not having an inventory and not delivering the products on time can harm the business.
The supply chain team should know about the demand for the products from time to time. So the historical data helps them in making informed decisions. The visual above shows that the forecast accuracy of 80.26% in the first Quarter of the year 2020 was not good as compared to the 85.92% forecast accuracy of the same period in the year 2019.
The Accessories is the product segment which suffered the most i.e 51.50%.
Executive View
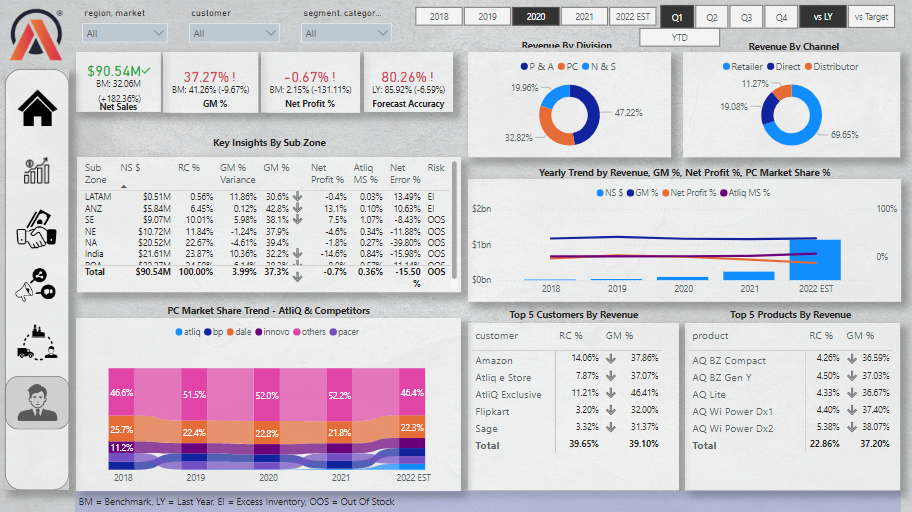
The Executive view is a consolidated report which includes KIPs like NS, RC%, GM%, NP%, Forecast Accuracy%, Market share and top-selling products and top customers. This view has almost all the important metrics in one view which a top stakeholder will like to see.
An executive view saves the time of senior stakeholders who do not want to go in depth about everything but also want to keep abreast with what’s going on in every department.
Tools Used In Project
- MS Excel
- MySQL
- Power BI
- Power BI Service
- DAX Studio
Learnings From Project
- Power BI
- Data Modelling
- Dashboard Creation & Designing
- Project Charter
- Stakeholder Mapping
- Going through P&L Statements
- Working on business transactions like creating Profit %, Gross Margin %, Forecast %, comparison in sales from previous periods etc. (All listed below in the DAX Formulas list)
The learning from this project was not limited to Power BI. The project has a business scenario where one has to go through the P & L statements where we needed to compare the performance of the products, product categories, markets, customers etc.
From providing the stats of finance to the performance of products in different markets among different customers is measured and displayed on the dashboards.
Power BI Features Learned & Used
- DAX Formulas (Listed at the bottom)
- Data Modeling
- Table Creation
- Creating Tool Tips
- Creating Switch using Bookmark
- Creating Dynamic Titles
- Learnt using conditional formatting for the blank results after applying filters
- Creating Dynamic Last Refresh Date
- Creation Of Different Views in a single report for different departments
Below is the list of DAX formulas that I have learnt to create Key measures to build the report.
DAX Formulas Learned & Used
- ABS Error =
SUMX(DISTINCT(dim_date[date]),
SUMX(DISTINCT(dim_product[product_code]), ABS([Net Error]))
) - ABS Error % = DIVIDE([ABS Error], [Forecast Qty], 0)
- ABS Error LY = CALCULATE([ABS Error],SAMEPERIODLASTYEAR(dim_date[date]))
- Ads & Promotions $ = SUM(‘fact_actuals_estimates'[ads_promotions])
- Atliq MS % = CALCULATE([Market Share %], marketshare[manufacturer]=”atliq”)
- BM Message = IF([NS BM $] = BLANK() || [GM % BM] = BLANK() || [NP % BM] = BLANK(), “BM Target is not available for the selected filters”, “”)
- Customer / Product Filter Check = ISCROSSFILTERED(dim_product[product]) || ISFILTERED(dim_customer[customer])
- Forecast Accuracy % = IF([ABS Error %]<>BLANK(), 1 – [ABS Error %], BLANK())
- Forecast Accuracy % LY = CALCULATE([Forecast Accuracy %], SAMEPERIODLASTYEAR(dim_date[date]))
- Forecast Qty =
var lsalesdate = MAX(LastSalesMonth[LastSalesMonth])
return
CALCULATE(SUM(fact_forecast_monthly[forecast_quantity]), fact_forecast_monthly[date]<=lsalesdate - Freight Cost $ = SUM(fact_actuals_estimates[Freight_cost])
- GS $ = SUM(fact_actuals_estimates[gross_sales_amount])
- Last Sales Month Home =
“Sales Data Loaded Until : ” & FORMAT(MAX(LastSalesMonth[LastSalesMonth]), “MMM YY”) - Manufacturing Cost $ = SUM(fact_actuals_estimates[manufacturing_cost])
- Market Share % = DIVIDE(SUM(marketshare[sales_$]),SUM(marketshare[total_market_sales_$]), 0)
- Net Error = [Forecast Qty]-[Sales Qty]
- Net Error % = DIVIDE([Net Error],[Forecast Qty],0)
- Net Error LY = CALCULATE([Net Error],SAMEPERIODLASTYEAR(dim_date[date]))
- Net Profit % = DIVIDE([Net Profit $],[NS $],0)
- Net Profit % LY = CALCULATE([Net Profit %], SAMEPERIODLASTYEAR(dim_date[date]))
- Net Profit $ = [GM $]+[Operational Expense $]
- NIS $ = SUM(fact_actuals_estimates[net_invoice_sales_amount])
- NP % BM =
SWITCH(TRUE(),
SELECTEDVALUE(‘Set BM'[ID])=1, [Net Profit % LY],
SELECTEDVALUE(‘Set BM'[ID])=2, [NP Target %]) - NP Target % = DIVIDE([NP Target $], SUM(NsGmTarget[np_target]), 0)
- NP Target $ = SUM(NsGmTarget[np_target])
- NS $ = SUM(fact_actuals_estimates[net_sales_amount])
- NS $ LY = CALCULATE([NS $], SAMEPERIODLASTYEAR(dim_date[date]))
- NS BM $ =
SWITCH(TRUE(),
SELECTEDVALUE(‘Set BM'[ID])=1,[NS $ LY],
SELECTEDVALUE(‘Set BM'[ID])=2,[NS Target $]) - NS Target $ =
var tgt = SUM(NsGmTarget[ns_target])
return IF([Customer / Product Filter Check], BLANK(), tgt) - Operational Expense $ = ([Ads & Promotions $]+[Other Operational Expense $])*-1
- Other Cost $ = SUM(fact_actuals_estimates[other_cost])
- Other Operational Expense $ = SUM(‘fact_actuals_estimates'[other_operational_expense])
- Performance Visual Title = [Selected P & L Row] & ” Performance Over Time”
- Post Invoice Deduction $ = SUM(fact_actuals_estimates[post_invoice_deductions_amount])
- Post Invoice Other Deduction $ = SUM(fact_actuals_estimates[post_invoice_other_deductions_amount])
- Pre Invoice Deduction $ = [GS $] – [NIS $]
- Quantity = SUM(fact_actuals_estimates[Qty])
- RC % = DIVIDE([NS $],CALCULATE([NS $],ALL(dim_market), ALL(dim_customer), ALL(dim_product)))
- Risk = IF([Net Error]>0,”EI”, IF([Net Error]<0, “OOS”, BLANK()))
- Sales Qty = CALCULATE([Quantity], fact_actuals_estimates[date]<=MAX(LastSalesMonth[LastSalesMonth]))
- Sales Trend Title = “NS & GM % For ” & SELECTEDVALUE(dim_customer[customer])
- Selected P & L Row = IF(HASONEVALUE(‘P & L Rows'[Description]), SELECTEDVALUE(‘P & L Rows'[Description]), “Net Sales”)
- Top / Bottom N Title = “Top / Bottom Products & Customers By ” & [Selected P & L Row]
- Total COGS $ = ‘Key Measure'[Freight Cost $] + ‘Key Measure'[Manufacturing Cost $] + ‘Key Measure'[Other Cost $]
- Total Post Invoice Deduction = ‘Key Measure'[Post Invoice Deduction $] + ‘Key Measure'[Post Invoice Other Deduction $]
- post_invoice_deductions_amount =
var res = CALCULATE(MAX(post_invoice_deductions[discounts_pct]),
RELATEDTABLE(post_invoice_deductions))
return res*fact_actuals_estimates[net_invoice_sales_amount] - post_invoice_other_deductions_amount =
var res = CALCULATE(MAX(post_invoice_deductions[other_deductions_pct]),
RELATEDTABLE(post_invoice_deductions))
return res*fact_actuals_estimates[net_invoice_sales_amount]
This is my first Power BI project which taught me how only creating a report is not enough for a Data Analyst. Technical Skills, Soft skills, being a good team player, a problem-solving mindset and get it done attitude are also needed to perform any task in this role.
I am going to work on more Data Analytics projects based on Marketing, Finance, Sports and various other fields. Please like and share this post with Data aspirants who are looking to start their careers as Data Analysts.